
.svg)


.avif)
.avif)
.png)


.avif)


%20Data%20to%20Me_BLOG_1080x600.avif)


.avif)


.avif)


.avif)


.avif)


No items found.

.svg)
.svg)
CI/CD diagrams are used to outline the processes involved in building, testing, and deploying each software iteration. If the CI/CD pipeline isn’t clearly defined, it can be difficult for an organization to evaluate and improve its CI/CD efforts. Creating a diagram is the first step toward optimizing your organization’s continuous delivery.
Without a clear picture of your pipeline, you may be missing critical areas of improvement. A modern CI/CD diagram can help you build a culture of DevOps and CI/CD mentality, reduce vulnerabilities, and streamline operations.
Copado is here to help you best understand CI/CD diagrams and how to integrate Salesforce solutions effectively.
Before you can build a useful CI/CD diagram, you need to be clear on what you're actually diagramming. The terms get used interchangeably, but CI and CD represent distinct stages of the pipeline, and confusing them leads to diagrams that misrepresent your process flow.
Continuous Integration is the practice of developers merging small, frequent code changes into a shared repository — often daily, sometimes hourly — rather than holding large batches of work for an end-of-sprint merge. Every time code is pushed, it is automatically deployed: the application builds, and a suite of tests runs immediately.
The goal is deceptively simple: catch integration problems early, when they're cheap to fix. The alternative of waiting until the end of a development cycle to merge every team members work is how teams end up in what's sometimes called "integration hell," a painful tangle of conflicting code, hidden bugs, and debugging marathons that can set a release process back by days or weeks.
In a CI/CD diagram, the CI process typically captures:
Continuous Delivery picks up where CI leaves off. Once the build passes its initial tests, CD starts automating everything needed to prepare that build for a production release, moving it through pre-production environments like testing and staging, and subjecting it to deeper validation.
The key characteristic of the CD process is that it produces a production-ready artifact at all times. Every build that passes the pipeline could theoretically be released to the next stages. The decision of when to release, however, remains a human one: a manual approval gate stands between the pipeline and production.
This is where your diagram starts to branch. CD-stage elements typically include:
Some organizations take automation all the way. In a Continuous Deployment process, the manual approval gate is removed entirely. Every change that passes all automated checks is released to production automatically, with no human intervention required.
This is the highest-maturity point on the CI/CD spectrum — and not every organization needs to reach it. But understanding where your team sits on this spectrum (CI only? Continuous Delivery? Full Continuous Deployment?) is foundational to building a diagram that actually reflects your real pipeline execution rather than an idealized version of someone else's.
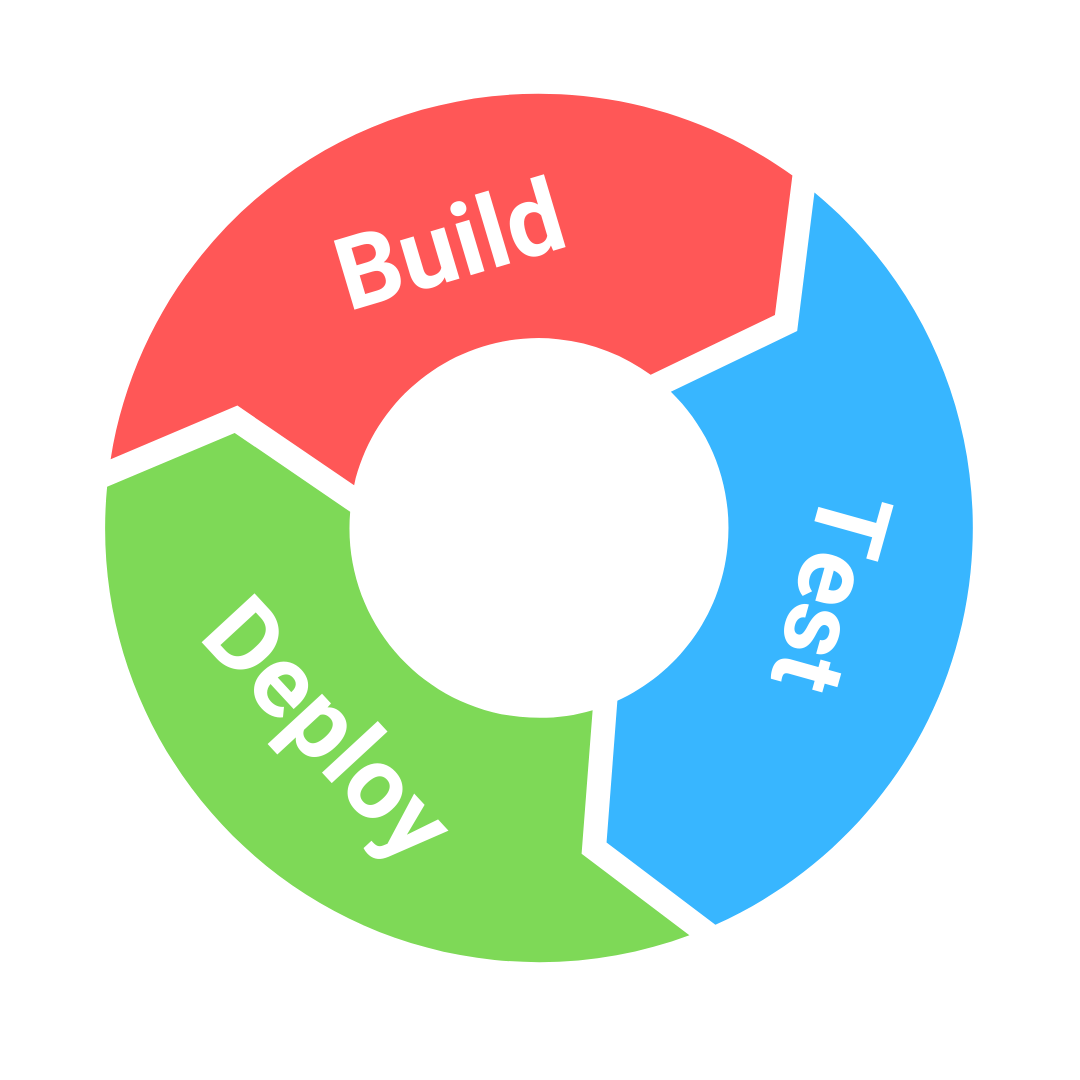
The CI/CD pipeline is based on the iterative process of Build, Test, and Deploy. All CI/CD diagrams will start with the same basic outline:

Each component of the CI/CD pipeline should fit into the Build, Test and Deploy phases. But this architecture must be customized to suit every organization.
For example, an organization’s test phase may include unit testing, integration testing, and performance testing. This expanded CI/CD diagram would appear as follows:

Likewise, the organization’s build strategy or deployment strategy may contain multiple steps: building a Docker image, code releases, and automated A/B testing. There are also offshoots from the pipeline for processes like incident response or manual review. The more developed your organization’s CI/CD diagram is, the more visibility you’ll have into your entire software development lifecycle.
You can also identify ways to shorten feedback loops through while retaining stability through CI/CD’s emphasis on automation and testing. Each iteration of the Build, Test and Deploy process increases the agility of the organization’s tech stack while still maintaining its stability.
CI/CD diagrams can do more than just help you understand your build processes. They can help you understand your value stream. To understand how, let’s first define some key terms:
Because your CI/CD pipeline supports business-critical processes, you should include it in your value stream management strategy. Creating a diagram of your CI/CD process can help you identify where value is getting stuck. In turn, this empowers complex decision-making and continuous improvement in the development process.
This is a crucial process for organizations looking to improve their pipeline architecture. For example, if your teams initially constructed a pipeline ad-hoc, adding tools to cover functionalities as needed, your diagram will reveal sites of redundancy and waste. Once you reveal the sticking points of your CI/CD process, you can begin to make improvements in the development process..
Organizations can build their CI/CD diagram by outlining their existing processes, what tools and people support them, and how to align them with the DevOps framework. Once your organization has built its CI/CD diagram, you can use it to help locate vulnerabilities, streamline operations, and follow CI/CD best practices. Diagramming your existing CI/CD pipeline can also help seamlessly transition your organization to a new technology stack.
CI/CD pipelines introduce automation and monitoring to speed up development, ensure increased transparency throughout the delivery process, and swiftly mitigate any potentially disruptive events.
DevOps strategies require that an organization remains agile and reliable. The CI/CD diagram provides a framework to identify likely candidates for automation in your pipeline, such as testing and branching.
It’s important to recognize that a CI/CD pipeline is part of a larger process, which involves other DevOps strategies and value stream management. As with your DevOps process as a whole, the CI/CD pipeline should continuously improve and evolve. Thus, the diagram is more accurately depicted as a continuous cycle.
Every iteration of the cycle is an opportunity to improve your processes, from code quality to efficient delivery. New tests are introduced to resolve new failure states. Tests that were previously run manually are automated. Teams implement new deployment strategies, A/B testing solutions, and disruption mitigation processes. Your CI/CD diagram can help you keep track of these improvements, prioritize correctly, and evaluate their impacts.
The diagram can also help you evaluate your security practices. To reduce vulnerabilities, organizations identify and analyze incidents as they occur and build them into the organization’s CI/CD process. To streamline operations, DevOps teams can shore up gaps and identify overlaps.
An organization’s CI/CD pipeline can become quite complex. There are multiple steps in every stage of the process, some manual and some automated. Once a CI/CD diagram has been drawn out, you can use value stream mapping and the theory of constraints to begin optimizing your processes, streamlining your technology stack, and fostering communication between stakeholders. Copado is a devops solutions company that can assist you with any of your CI/CD pipeline needs.
Nevertheless, optimizing your CI/CD pipeline is a critical step toward setting your organization up for success — and organizing your technology stack. Through your CI/CD diagram, you can isolate areas for improvement and automation to prepare your organization for the next step of its digital transformation.
Release Faster, Eliminate Risk, and Enjoy Your Work.
Try Copado Devops.
Explore our DevOps resource library. Level up your Salesforce DevOps skills today.

.avif)


.svg)