
.svg)


.avif)
.avif)
.png)


.avif)


%20Data%20to%20Me_BLOG_1080x600.avif)


.avif)


.avif)


.avif)


.avif)


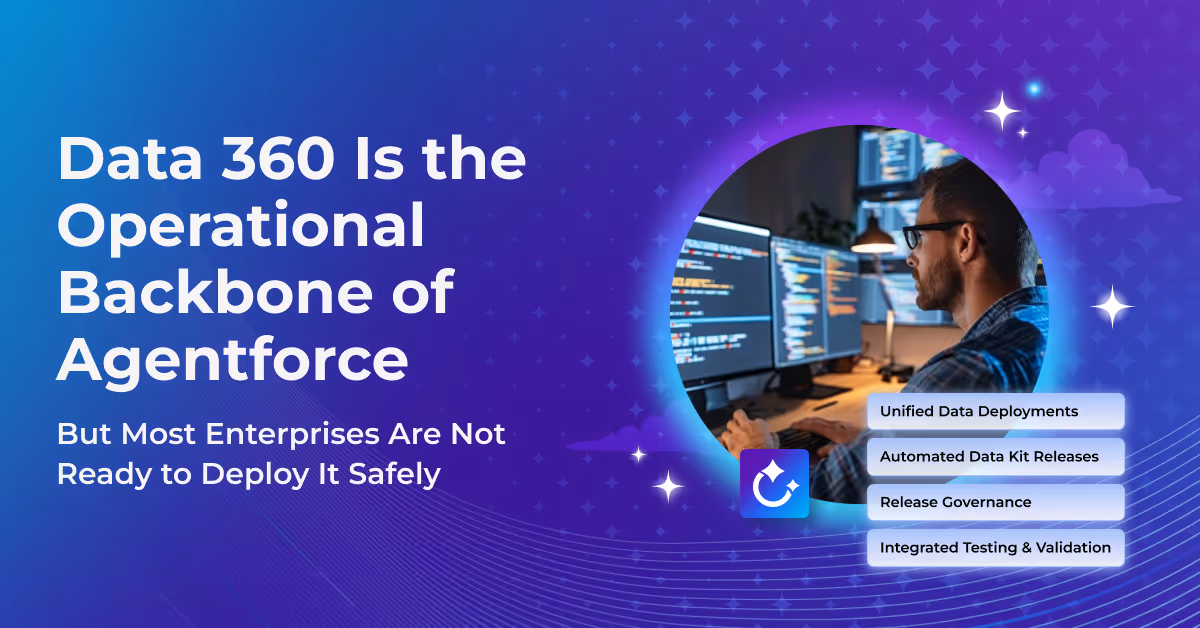
End-to-End Visibility


.svg)
.svg)
The title says it all, doesn’t it? You cannot optimize what you don’t measure...and you cannot measure what you cannot see. One of the central aims of DevOps is to continually improve collaboration and processes in order to increase the quality and speed of innovation, thereby delivering more value to customers faster. And the only way to continually improve your processes is to measure your processes, team performance, and value flow. When you can visualize and quantify how your team is operating, you gain the insights you need to reduce waste and drive improvements.
One effective way to do this is through value stream maps—visual depictions of each stage of your process that quantify lead time, change failure rate and other key performance metrics. Viewed holistically, the value stream map documents the end-to-end flow of delivering value, which helps you quantify the full resource investment required to build and deliver a feature. By then quantifying performance at each stage of this value flow, you can assess where there may be gaps, inefficiencies or breakdowns in your processes. When teams address these issues they both improve specific performance areas and the entire value stream.
That all sounds great in theory, but how do you get started with documenting a value stream map in order to actually realize this potential value? Let’s take a look.
Mapping your value stream and tracking the key metrics within it helps to quantify a team’s performance and pinpoint areas of improvement.
All of this can be done manually. In fact, putting “pen to paper” is a great way to start conceptualizing what processes you need to outline and eventually automate. Getting Started with Value Stream Maps will give you more background on the genesis of value stream maps, how to get your thoughts down on paper or a whiteboard, and how you can manually track each piece of the process. But to get started, you can follow these steps to make sure your stream is as accurate as possible:
While “pen-to-paper” value stream maps are a great start, they only capture a single moment in time and they’re highly reliant on estimates. For this exact reason, the IT industry is seeing the rise of value stream management platforms. An automated tool like Copado’s DevOps 360 Value Stream Maps allows you to visualize your specific value stream through an easy-to-configure UI. The tool allows you to select specific metrics to track at each stage, and these metrics are tied directly to user stories to provide you a real-time, accurate view of how work is flowing (or not flowing!) through your value stream.
Once you’ve thought through and outlined each of these areas, you’ll be able to physically see the invisible processes that comprise your development lifecycle and how teams deliver value to customers. But that’s only the first part of the puzzle. The real value comes from digging into four main indicators of performance and understanding, monitoring, and influencing how they change over time.
The benefits of a value stream mapping go beyond process visualization. They also track changes over time, quantifying trends and allowing you to better identify anomalies. Together, process visualization and performance trends help quickly identify bottlenecks, inefficiencies and risk.
So, what are those all-important metrics? DORA, DevOps Research & Assessment, defines four metrics to assess across the value stream:
While lead time and deployment frequency are indicators of the velocity of innovation, change failure rate and mean time to recovery are indicators of reliability and trust. Together, they paint a picture of how effective a development team and the processes they follow are, as well as how and where they can improve to bring more value to the organization as a whole.
Let’s dive into more detail to learn how each impacts value delivery success.
Simply put, lead time is the time it takes to release a feature to production after development is complete. A piece of work (a feature or application, for example), only becomes valuable when the end-user can access it. Until that point, the value of the work cannot be realized. So, it becomes important to know how long work is “sitting around” in a completed state before a customer can begin to use it. If that time is considerably long, value delivery is delayed and ROI on that development effort is left on the table.
When it comes to lead time, remember “shorter is better.” Delivering work to end users quickly enables faster feedback cycles to the product and development teams, enabling them to adapt quickly to users’ needs and changes in the market, ultimately delivering more features that meet their needs, faster. These feedback cycles are critical to staying relevant with a user group and reducing the amount of work that goes unused because it either sat on the shelf too long or didn’t include the most up to date and relevant feedback since the last release. The value of decreasing lead time is two-fold: not only do end-users get access to valuable features faster, but the continual relevance of future work delivered means the product is more likely to meet their needs.
Deployment frequency measures how often teams release work to production. As mentioned above, work only creates value when end-users can use it. If work is deployed and made available more often, it follows that more value is realized over time, which ultimately drives more significant business outcomes.
Over time, deployment frequency should ideally increase. Teams that deploy more frequently generally see lower risk in each deployment and faster time to value for many reasons, which we’ll dive into in Part 2 of this series.
Next up is change failure rate, which measures the percentage of production releases that result in a disruption to the business...which can have very costly consequences. This measurement is a key indicator of quality—higher quality code and more rigorous testing is less likely to introduce breaking changes. Driving this number closer to zero over time should be one of your optimization objectives, as it helps to mitigate risk of customer exposure to bugs and failures and is essential for maintaining business value (and trust!) over time.
Mean time to recovery indicates how long it takes your team to troubleshoot, fix, and/or roll back a deployment failure from production. A lower number is better here—if it takes teams considerable time to address failures, the business will undoubtedly suffer. Downtime of your systems not only causes low productivity internally, but it also affects how customers interact with your services. If this happens semi-frequently or for long stretches of time, it can begin to erode customer trust. All of these outcomes have financial impact, and that negative financial impact increases as time to recover increases. One goal should be to minimize downtime as much as possible, and working to optimize mean time to recovery is a key way to keep that metric in check.
While powerful on their own, all of these metrics come together to create a Software Innovation Performance Matrix that shows how your company compares to others’ performance overall. When compared in this way, it becomes clear that the highest performing companies balance both speed and quality. They deliver innovation more rapidly and with fewer errors than companies in the less effective tiers of this matrix. Most companies will fall primarily in the same category (elite, high performer, etc) for each metric due to the interconnectedness of these measurements, but it is possible to be stronger in one area and weaker in others.

There are multiple factors that influence the “numeric outcome” of each performance indicator across the value stream. Understanding where you stand by benchmarking your teams’ performance against your peers is only one part of the equation. The real value comes from taking that information, using it to identify areas of improvement (which of those metrics is lagging? Where is waste? Is there an easily identifiable bottleneck?), and then acting on that area of opportunity to not only improve your teams’ work output but HOW they accomplish that output.
As you practice identifying these areas and working to address them, you’ll see real ROI from implementing value stream maps and will watch your teams progress towards reaching that “elite” DevOps innovation performance status in each of the four key areas. Improvement is a continual process that comes to life in small, focused, discernable stages that build on one another, but by using Copado’s Value Stream Maps to get an idea of your starting point and measure improvements over time, you’ll be one step closer to the “top” and will capture real value for the business as a whole with each step.
Looking for more detail on how to identify areas of improvement and begin optimizing your process to realize these value gains faster? Stay tuned for Part 2, Driving Outcomes through Value Stream Maps: 4 Strategies for Progressing through the Software Innovation Performance Matrix. And if you don’t want to wait, we’d love to help you get started now.
Release Faster, Eliminate Risk, and Enjoy Your Work.
Try Copado Devops.
Explore our DevOps resource library. Level up your Salesforce DevOps skills today.

.avif)


.svg)